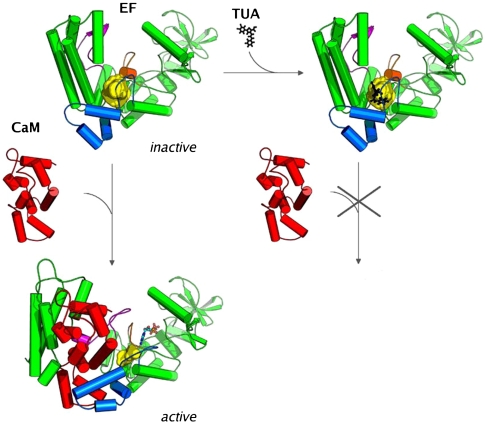
Fig. 1.
Scheme of the virtual screening approach used to prevent the CaM activation of EF. The pocket to which the ligand was docked is shown in yellow (483 and  in the inactive and active forms, respectively), EF and CaM are drawn in cartoon format. Switches A, B, and C in EF are highlighted in blue, orange, and magenta, respectively.

