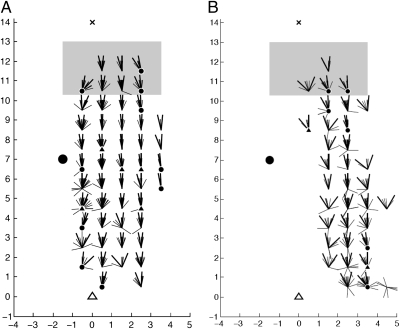
Fig. 4.
Accuracy of direction-based predictions. For all probe points within each 1-m grid square that contains at least four probe points, segments show residuals between actual and predicted headings. Shown originating at the center of grid squares, with perfect coincidence (zero residual) pointing upwards. Larger lines indicate 95% confidence intervals for mean residuals within grid squares. Circles or triangles indicate where a zero residual lies outside confidence intervals: triangles by <1°, circles by >1°. To be conservative, confidence intervals are calculated only from heading directions in the upper two (nestward) quadrants and without any Bonferroni corrections. (A) R-S distance ratio < 1.75. (B) R-S distance ratio > 1.75.

