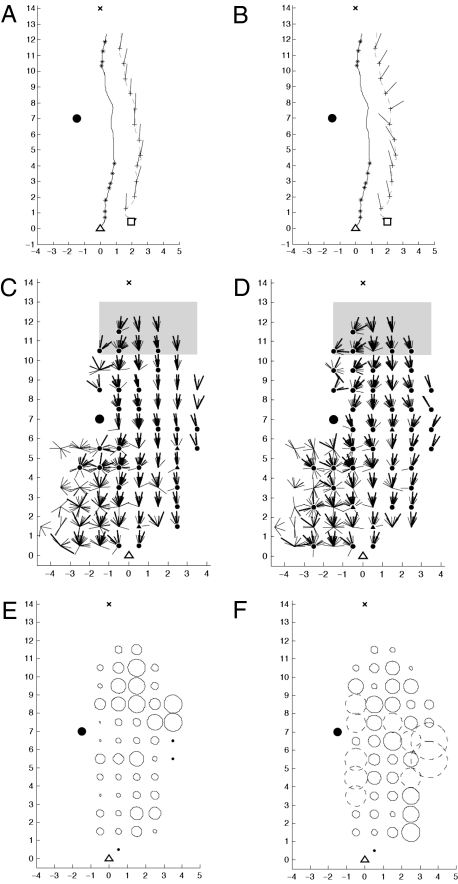
Fig. 5.
Distance-based predictions. (A and B) Matching probe points to reference points that have the same distance from the landmark. Lines from probe points show predicted heading directions. (A) Heading directions encoded as compass directions. (B) Heading directions encoded as position of landmark on retina. (C and D) Residuals between actual and predicted headings using encodings in A and B, respectively. (E and F) Proportion of trajectories that lie between direction-matched and distance-matched predictions. Proportion is shown as size of radius. Circle is dashed where proportion is >0.5. (E) Heading encoded as compass direction. (F) Heading encoded as retinal position of landmark.

