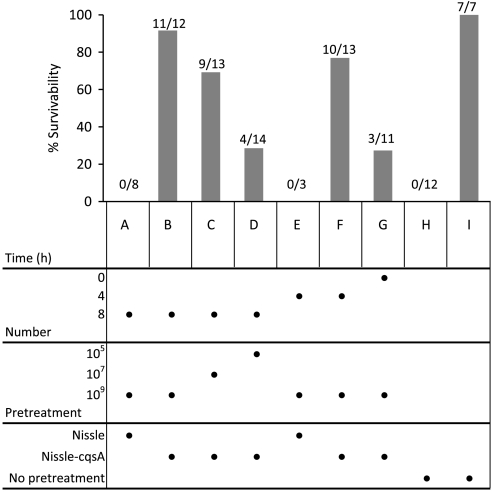
Fig. 2.
Survival of infant mice fed V. cholerae with different pretreatments. Infant mice were fed with E. coli Nissle 1917 (Nissle), E. coli Nissle 1917 expressing the V. cholerae autoinducer gene cqsA chromosomally (Nissle-cqsA), or no bacteria (no pretreatment) before being challenged with V. cholerae (A–H). “No pretreatment” mice were either challenged with V. cholerae (H) or not (I). Pretreatment times, numbers of bacteria fed, and bacterial strains used are shown in the figure under the bar graph. Mice were fed with bacterial treatments either 0, 4, or 8 h before V. cholerae challenge. Survival of mice after 48 h is shown. The total amount of bacteria fed each mouse (number) is also given. Directly below each bar on the chart is the set of conditions for that experiment. For example, in B, 109 cells of Nissle-cqsA were fed to mice 8 h before V. cholerae challenge and 11 out of 12 mice survived for a survivability of 92%. In D, 105 cells of Nissle-cqsA were fed to mice 8 h before V. cholerae challenge and 4 out of 14 mice survived for a survivability of 29%. The numbers of mice surviving in each group is shown over the total number of mice in that group.

