Fig. 4.
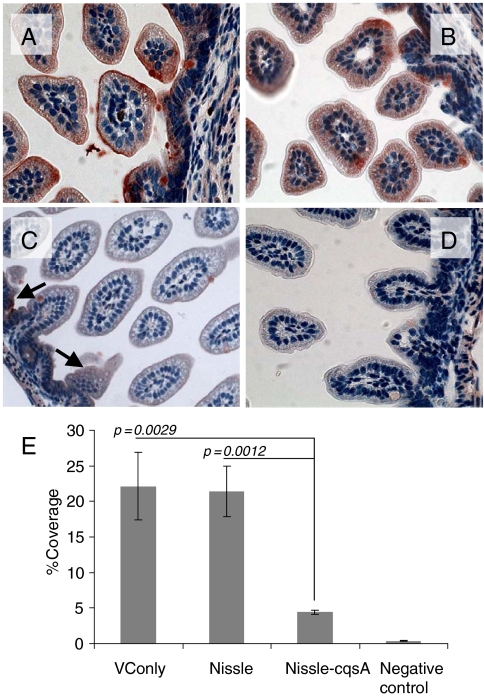
CT binding to mouse intestines. Infant mice were given the following pretreatments: no treatment (A), E. coli Nissle 1917 (Nissle) (B), E. coli Nissle 1917 engineered to express V. cholerae cqsA (Nissle-cqsA) (C). Mice in A–C were then challenged with V. cholerae. Mice in D were not pretreated and were not challenged with V. cholerae. Intestines were stained for the presence of CT. Red staining indicates the presence of CT. Arrows in C indicate red staining. Slides from triplicate mice for each treatment were analyzed using ImageJ software (NIH) to quantify the amount of red staining (CT) present. The percentage of red coverage for each slide was determined and the values averaged (D). Error bars represent 1 SD. The p values are for a Student t test with n = 3. Images in A–D were taken at 40× magnification.

