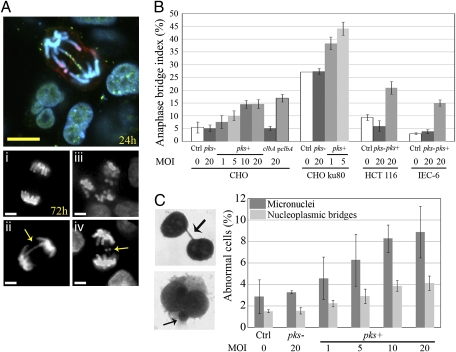
Fig. 3.
Infection with pks+ E. coli induces anaphase bridges and micronuclei. (A) (Upper) Anaphase bridge 24 h after infection with pks+ E. coli (DNA shown in blue, γH2AX in green, and pH3 in red). (Lower) Seventy-two hours after infection (i) normal anaphase, (ii) anaphase bridge (arrow), (iii) multipolar mitosis, (iv) lagging chromosomes (arrow). (Scale bars, 10 μm.) (B) Anaphase bridge index in CHO, ku80-defective CHO, HCT-116, and IEC-6 cells 3 d after infection. (C) Cytochalasin-B–induced cytokinesis block assay. (Left) Images and arrows show a nucleoplasmic bridge (formed by anaphase bridging) and a micronucleus (formed by lagging or acentric chromosomes) in CHO cells 3 d after infection. (Right) Micronuclei and nucleoplasmic bridges were counted in 1,000 binucleated cells. Error bars in B and C represent the SE from three experiments.

