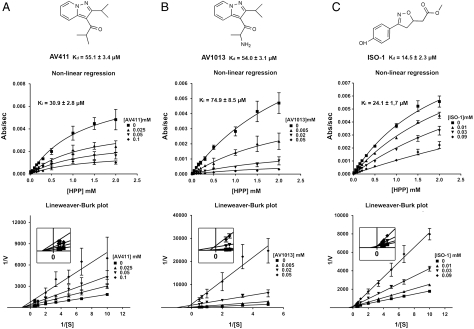
Fig. 1.
Chemical structures and kinetic graphs of AV411, AV1013, and ISO-1. Each Lineweaver–Burk plot reveals the noncompetitive inhibition pattern of AV411 (A) and AV1013 (B), and the competitive inhibition pattern of ISO-1 (C). The Lineweaver–Burk of AV1013 demonstrates a small effect on Km (B). The inserts in the Lineweaver–Burk plots show the intersections near the origin. Dissociation constants (Kds) measured by Trp (AV411 and AV1013) and Tyr (ISO-1) fluorescence are presented below the chemical structures.

