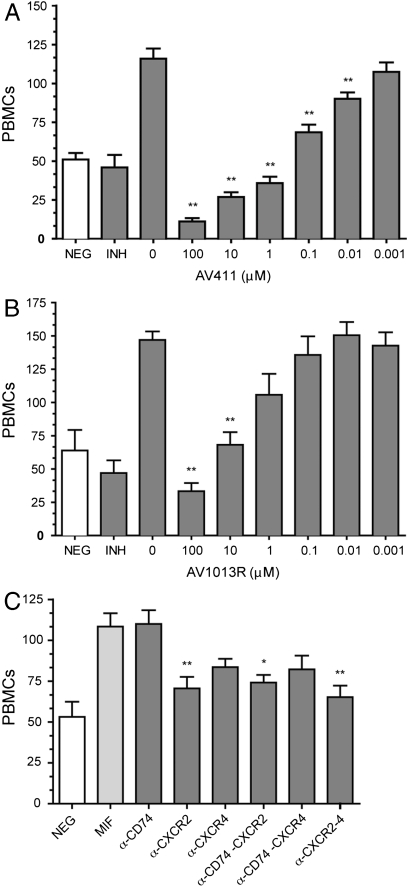
Fig. 2.
PBMC cell migration inhibition. PBMC migration dose response for (A) AV411 and (B) (R)-AV1013. For all panels, negative control (NEG) is without rhMIF. Positive control is with rhMIF but no drug added. P values represent significant difference relative to positive control. One, two, or three asterisks represent p < 0.05, 0.01, or 0.001, respectively. Inhibitors (INH) in (A) and (B) are AV411 and (R)-AV1013, respectively. (C) Inhibition of MIF-induced chemotaxis of PBMCs in the presence of individual or paired combinations of monoclonal antibodies (10 μg/mL each) directed against MIF receptors (CD74, CXCR2, and CXCR4). P values represent comparison to the MIF-mediated migration in the absence of the antibodies.

