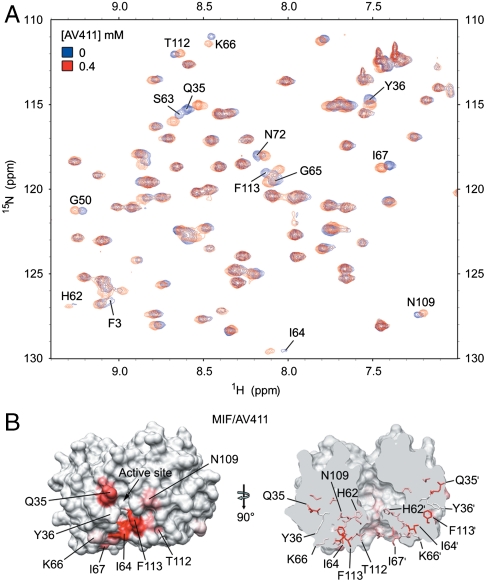
Fig. 3.
AV411 and AV1013 interactions with rhMIF in solution. (A) HSQC spectra of rhMIF with (red) or without (blue) AV411 are overlaid. (B) The surface of a rhMIF trimer is shown with the degree of chemical shift change, colored in red, upon binding of AV411 (Left). The highest intensity indicates 0.094 ppm of chemical shift change. On the right, is the surface of the trimer rotated by 90° along the trimer axis and clipped to show relative locations of the mapped residues. The residues are colored in the same manner as with the left. Only the residues revealing large chemical shifts are labeled.

