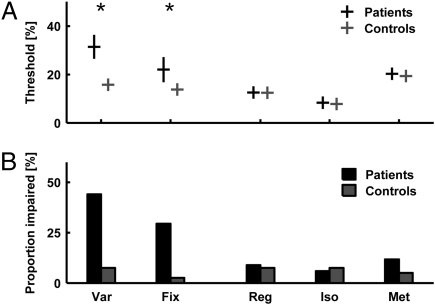
Fig. 2.
Timing thresholds group data and frequency of occurrence of individual deficits for patients (n = 34; black) compared with controls (n = 40; gray). (A) Mean timing thresholds and SEMs. Group differences were significant for Var and Fix. (B) Proportion of significant impairment at the individual level Note high values for Var and Fix, contrasted by low values for Reg, Iso, and Met. Significance level was P < 0.05.

