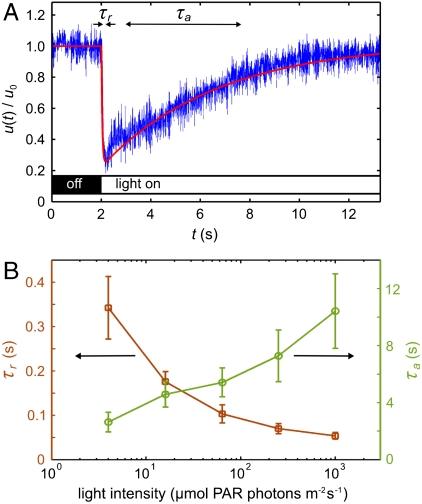
Fig. 2.
Characteristics of the adaptive photoresponse. (A) The local flagella-generated fluid speed u(t) (Blue), measured with PIV just above the flagella during a step up in light intensity, serves as a measure of flagellar activity. The baseline flow speed in the dark is u0 = 81 μm/s for this dataset. Two time scales are evident: a short response time τr and a longer adaptation time τa. The fitted theoretical curve (Red) is from Eq. 4. (B) The times τr (Squares) and τa (Circles) vary smoothly with the stimulus light intensity, measured in terms of PAR. Error bars are standard deviations.

