Fig. 3.
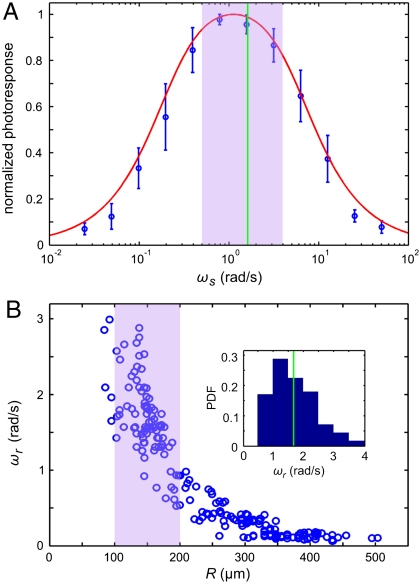
Photoresponse frequency dependence and colony rotation. (A) The normalized flagellar photoresponse for different frequencies of sinusoidal stimulation, with minimal and maximal light intensities of 1 and 20 μmol PAR photons m-2 s-1 (Blue Circles). The theoretical response function (Eq. 5, Red Line) shows quantitative agreement, using τr and τa from Fig. 2B for 16 μmol PAR photons m-2 s-1. (B) The rotation frequency ωr of V. carteri as a function of colony radius R. The highly phototactic organisms for which photoresponses were measured fall within the range of R indicated by the purple box, and the distribution of R can be transformed into an approximate probability distribution function (PDF) of ωr (Inset), by using the noisy curve of ωr(R). The purple box in A marks the range of ωr in this PDF (green line indicates the mean), showing that the response time scales and colony rotation frequency are mutually optimized to maximize the photoresponse.

