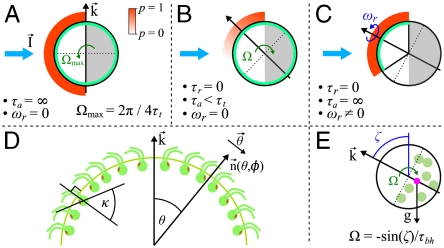
Fig. 4.
Heuristic analysis of the phototactic fidelity. A–C illustrate simplified phototaxis models. Photoresponsive regions are colored green, the region that actually displays a photoresponse is in shades of red, and shaded regions are gray. (A) If τa = ∞, ωr = 0, and the responsive region is as drawn, the posterior-anterior axis k will achieve perfect antialignment with the light direction I. The time scale for turning τt ∼ 3.3 s can be estimated by assuming that the fluid velocity on the illuminated side is reduced to 0.7 of its baseline value and using Eq. 8 without bottom-heaviness. (B) If τa < τt, and ωr = 0, the photoresponse may decay before the optimal orientation has been reached. After the initial transient in A has decayed, the largest photoresponse (i.e., flagellar down-regulation) is in the region that just turned into the light. As an illustration, the configuration drawn in this panel surprisingly implies that the organism would turn away from the light, indicating that before this orientation is reached the steering is stopped at a suboptimal orientation of k with I. A remedy against this orientational limitation would be ωr ≠ 0. (C) The best attainable orientation towards the light is drawn, if the photoresponse is localized in a small anterior region, and the eyespots display an all-or-nothing response as they move from the shaded to the illuminated side. (D) Measurements of the eyespot (Orange) placement yield κ = 57° ± 7° (see SI Text). (E) Volvox is bottom-heavy, because the center of mass (Pink) is offset from the geometric center of the colony as indicated.

