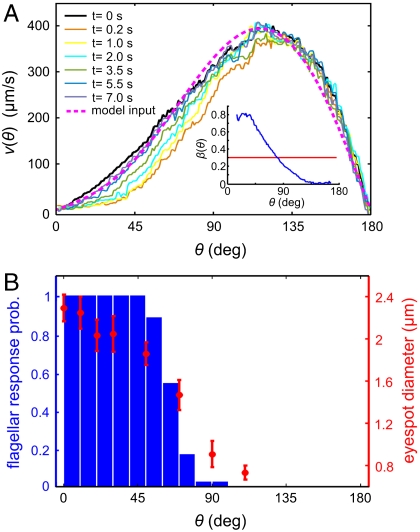
Fig. 5.
Anterior-posterior asymmetry. (A) The anterior-posterior component of the fluid flow, measured 10 μm above the beating flagella, following a step up in illumination at time t = 0 s. The dashed line indicates the approximation to v0(θ) used in the numerical model. (Inset) β(θ) is blue (with p normalized to unity), and the mean β is red. (B) The probability of flagella to respond to light correlates with the size of the somatic cell eyespots. The light-induced decrease in fluid flow occurs beyond the region of flagellar response because of the nonlocality of fluid dynamics.

