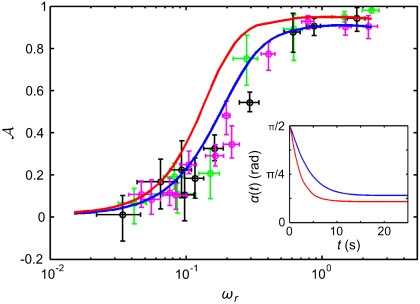
Fig. 7.
The phototactic ability  decreases dramatically as ωr is reduced by increasing the viscosity. Results from three representative populations are shown with distinct colors. Each data point represents the average phototactic ability of the population at a given viscosity. Horizontal error bars are standard deviations, whereas vertical error bars indicate the range of population mean values, when it is computed from 100 random selections of 0.1% of the data. A blue continuous line indicates the prediction of the full hydrodynamic model; the red line is obtained from the reduced model. (Inset) α(t) from the full and reduced model at the lowest viscosity.

