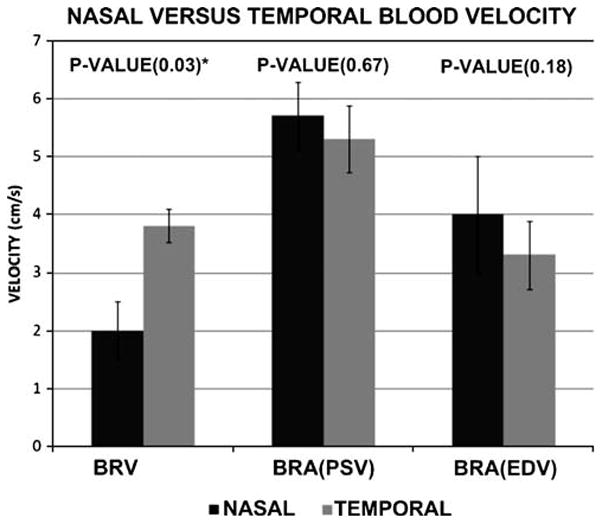
Fig. 4.

Graph shows the comparison between the nasal and temporal sides of the branch retinal vein (BRV) and branch retinal artery (BRA) end diastolic velocity (EDV) and peak systolic velocity (PSV). Results represent the mean blood velocity and error bars represent ± 1SD. * indicates statistical significance
