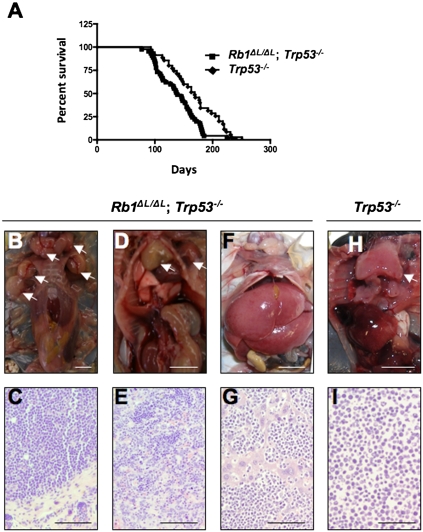
Figure 3.
More aggressive tumors in Rb1ΔL/ΔL; Trp53−/− mice. (A) Kaplan-Meier survival proportions are shown for Rb1ΔL/ΔL; Trp53−/− (n = 45) and Trp53−/− (n = 35) mice. (B–I) Representative images of cancers found in Trp53−/− control and Rb1ΔL/ΔL; Trp53−/− compound mutants. (B) This necropsy reveals lymphoma with multiple affected lymph nodes, as indicated by arrows. (C) H&E staining of a tissue section from one of the affected lymph nodes from B. (D) Mouse with thymic lymphoma and a sarcoma near its left forelimb; both are indicated by arrows. (E) Histological analysis of the sarcoma in D reveals extensive infiltration of this tumor by cells from the neighboring lymphoma. (F) Necropsy demonstrates an enlarged liver in this Rb1ΔL/ΔL; Trp53−/− mutant mouse. (G) Histology of the liver in F reveals extensive infiltration by lymphocytes, indicative of metastasis. (H) Necropsy of a Trp53−/− control mouse shows an enlarged thymus that is typical of these mice. (I) This micrograph shows H&E staining of a thymic lymphoma from a Trp53−/− mouse. Bars: B,D,F,H, 1 cm; C,E,G,I, 100 μm.

