Figure 4.
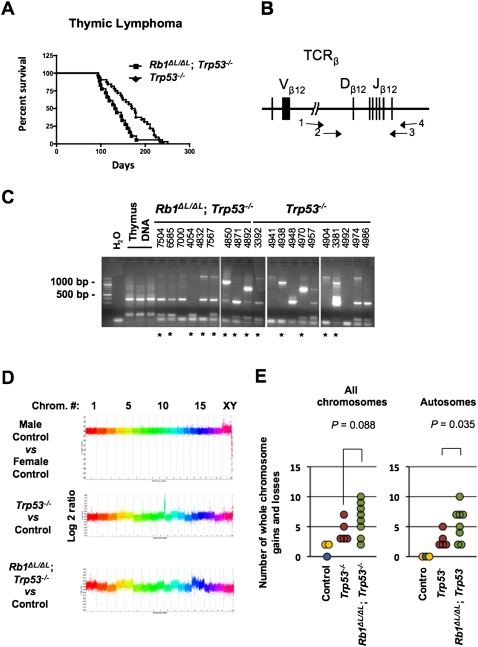
Increased genomic instability in Rb1ΔL/ΔL; Trp53−/− thymic lymphoma. (A) Kaplan-Meier survival proportions are shown for Rb1ΔL/ΔL; Trp53−/− (n = 18) and Trp53−/− (n = 32) mice that succumbed to thymic lymphoma. (B) Schematic diagram of the T-cell receptor β (TCRβ) locus that was PCR-amplified to assess clonality of thymic lymphomas. Primer pairs 1 and 4 and 2 and 3 were used in a nested strategy to amplify rearranged forms of this gene found in tumor samples, as described in the Materials and Methods. (C) Agarose gel electrophoresis of T-cell receptor β (TCRβ) PCR, including a water-only negative control, and three normal thymus samples as positive controls. Four-digit numbers correspond to ear tag numbers for individual mice, and are present to allow correlations with pathology and array data in Supplemental Tables 1 and 2. The asterisks indicate samples that were used for aCGH analysis. (D) Control, or tumor DNA versus control, was used for hybridization to whole-genome arrays to determine regions of gain or loss in thymic lymphoma samples. Representative graphs depicting log2 ratio values plotted against chromosome number are shown. Data points from individual chromosomes are shown in different colors. (E) Whole-chromosome gains and losses were inferred by differences in an entire chromosome and were compared with controls. The number of whole-chromosome changes for each tumor is plotted against their genotypes. The control male versus control male hybridization is shown in blue, the male versus female hybridizations are shown in yellow, and Trp53−/− and Rb1ΔL/ΔL; Trp53−/− samples are denoted by red and green, respectively. The analysis of all chromosomes, or autosomes alone, are shown. The mean number of changes was compared between genotypes using a t-test.

