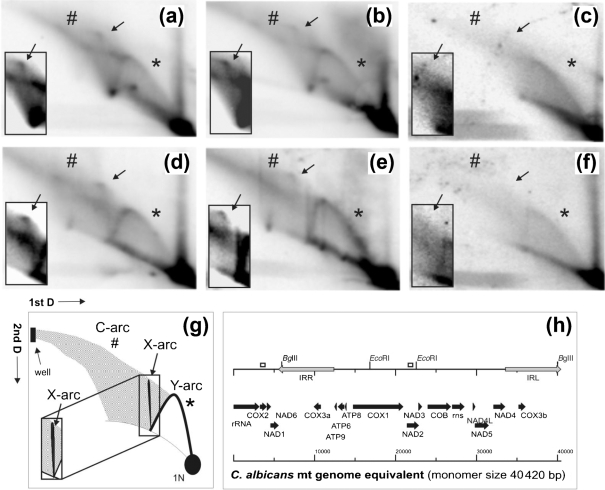
Fig. 5.
2D electrophoresis. Purified mtDNA of CAI4 (a, d), Δgcf1/PMET3-GCF1 grown under derepressed conditions (b, e) and Δgcf1/PMET3-GCF1 grown under repressed conditions (c, f) was digested with BglII (a, b, c; fragment size 6328 bp, spanning base pairs 40 026 to 5934 in vivo) probed for a portion of cox2 (probe spanning base pairs 3285 to 3654), and EcoRI (d, e, f; fragment size 5726 bp, spanning base pairs 16 828 to 22 554) probed for nad2 (probe spanning base pairs 21 500 to 21 850). Positions of probes for cox2 and nad2 are indicated as open boxes in (h). (g) Graphical interpretation of (a–f). (h) An overview of a one-genome equivalent (monomer; 40 420 bp) of the C. albicans mitochondrial genome. Radiographs reveal a standard Y-arc [indicated by an asterisk; interpreted in (g)] of strand-coupled replication intermediates on all panels, albeit at reduced strength in (c) and (f). Each panel contains an overexposed section displaying the region of the descending Y-arc to the 2N spot (an almost fully replicated restriction fragment) and X-arc (indicated by an arrow) of Holliday junctions. In strain Δgcf1/PMET3-GCF1 grown under repressed conditions (c, f), X-arcs are reduced to a level below detection, and the C-arcs (indicated by #), which consist of complex high-molecular-mass recombination structures and branched molecules, are significantly reduced in comparison to CAI4 (a, d) and Δgcf1/PMET3-GCF1 grown under derepressed conditions (b, e).

