
Figure 2.
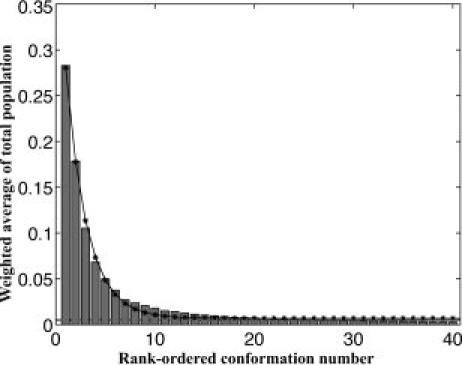
Fraction of the turn the population covered by the top 40 conformers. Every histogram bar represents a weighted-average of the total turn population subsumed by each of the 12 structural categories. Successive bars are rank-ordered by frequency of occurrence. For example, the leftmost bar indicates that the weighted-average of the single-most frequent conformer from each category accounts for over 25% of the total turn population. As rank-order decreases, the subsumed population diminishes exponentially (solid line with asterisks), sinking below 5% beyond the top five conformers, and leveling off to an almost horizontal asymptote after 20 conformers. Conformations contributing less than 0.5% (dashed line) to their respective structural categories were eliminated. The exponential curve fit to these data is given by the equation y = 0.4 × e-0.47 + 0.01.