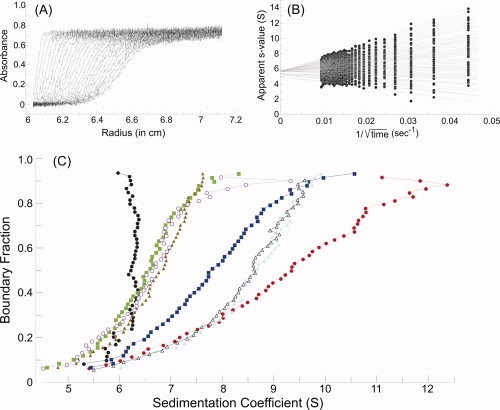
Figure 5.

Sedimentation velocity centrifugation. (A) Raw data. The analytical ultracentrifuge cell contained SecA at 4 μM dimer in 10 mM Hepes-KOH, 300 mM KOAc, 5 mM Mg(OAc)2, 1 mM TCEP, pH 7.6. Thirty-five successive scans are shown to display the sedimenting boundary. Scans three through 35 were subjected to analysis as shown in B. (B) van Holde and Weischet analysis.12 Each point is the apparent sedimentation coefficient (s*) of each fraction of the boundary, and each vertical array of 50 points represents one boundary. Each line is the best fit through the points for a particular boundary fraction. (C) Distribution plot of extrapolated s values. Protein samples were subjected to centrifugation, and the raw data were analyzed as described above. The intercepts of each line in the van Holde and Weischet analysis were plotted versus the boundary fraction to which the line pertained. The samples subjected to analysis were SecA (black circles), SecA:SecB (red circles); SecA:SecB and N-terminal SecA peptide (blue squares); SecA:SecB and both the N-terminal SecA peptide and zinc-containing peptide (green squares); SecA:SecB142 (light blue triangles); SecA:SecB142 and N-terminal SecA peptide (gray open triangles); SecA:SecB142 and both the N-terminal SecA peptide and zinc-containing peptide (brown triangles); SecAdN10:SecB142 (purple open circles). The proteins were present at 4 μM SecA dimer:4 μM SecB tetramer, 120 μM N-terminal peptide and 40 μM zinc-containing peptide.
