Figure 1.

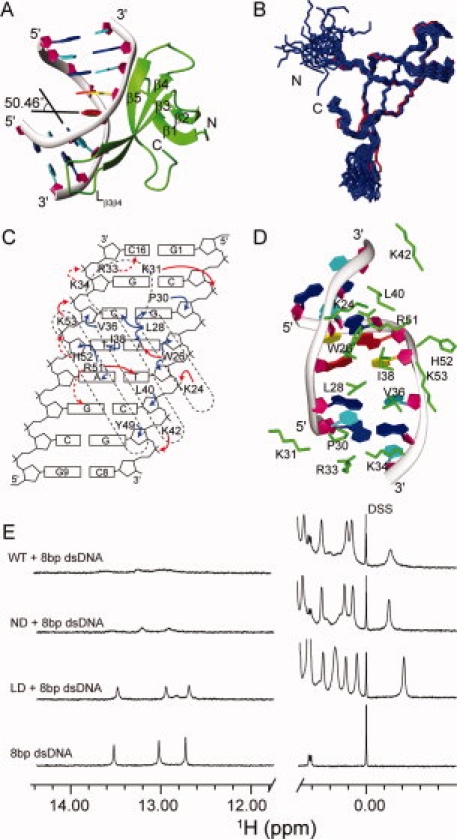
Crystal structure and protein–DNA interactions of the Cren7–dsDNA complex. A: Crystal structure of the Cren7–dsDNA complex. Cren7 is shown as green ribbon. The backbone of dsDNA is shown as gray ribbon, and the sugar ring is depicted as filled purple pentagon; A, T, C, G bases are colored in red, yellow, cyan, and blue, respectively. B: Superimposition of Cren7 in the complex (red) with the NMR solution structures of Cren7 (blue) (PDB: 2JTM). C: Schematic diagram summarizing all Cren7–DNA contacts. The filled red, filled blue, and dashed red arrows represent direct hydrogen bonds/salt bridges, van der Waals close contacts, and potential hydrogen bonds/salt bridges, respectively. D: Protein–DNA interactions in the structure. The side chains of residues involved in the interactions are shown as green sticks. E: 1D 1H NMR spectra of the Cren7–dsDNA complexes. The high field signals near 0.00 ppm are from methyl group of proteins, and the low field signals near 13.00 ppm are from dsDNA hydrogen-bonded base pairs. Full length Cren7 (WT) and Cren7ND show similar NMR spectra in the protein–dsDNA complexes. The peaks near 13.00 ppm are broadened extremely, indicating that almost all the dsDNA molecules form the complexes with Cren7 (WT). The spectrum of Cren7LD with dsDNA shows only slightly broadened peaks compared with those of the free dsDNA near 13.00 ppm, which indicates that the dsDNA in the Cren7LD-dsDNA complex is in a small fraction and fast exchange with the free dsDNA. An interactive view is available in the electronic version of the article. PRO385 Figure 1
