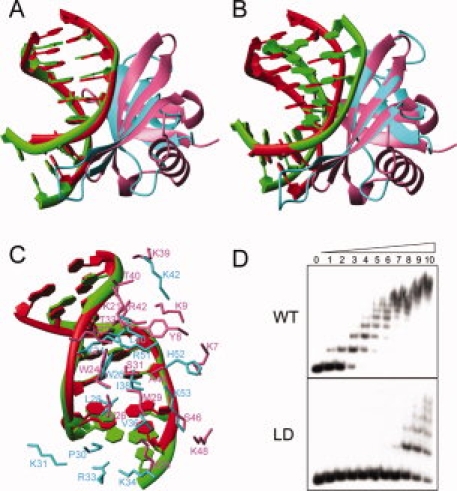
Figure 2.

Comparison of Cren7–dsDNA and Sul7d–dsDNA (PDB: 1AZP) complexes. A: Superimposition of dsDNA in the two complexes. Structures are superimposed using the backbone phosphor atoms of G3-C8 and C10-G15 in Cren7–dsDNA complex and C2-G7 and G11-C16 in Sul7d–dsDNA complex. The dsDNA and protein in the Cren7–dsDNA complex are colored in green and cyan, respectively. The dsDNA and protein in the Sul7d–dsDNA complex are colored in red and pink, respectively. B: Superimposition of proteins in the two complexes using the backbone atoms of the interface secondary structure residues (Cre7: 24–28, 36–42, 49–53; Sul7d, 22–26, 29–35, 40–44). C: Protein–DNA interactions in the both complexes superimposed as (A). D: The electrophoretic mobility shift assays of wild-type and loop-deletion mutant Cren7LD binding with a 60 bp dsDNA. Protein concentrations were 0, 0.02, 0.04, 0.08, 0.16, 0.31, 0.63, 1.3, 2.5, 5, and 10 μM, respectively. The apparent dissociation constants are ∼0.08 μM and 5 μM for wild-type Cren7 and Cren7LD, respectively. An interactive view is available in the electronic version of the article. PRO385 Figure 2
