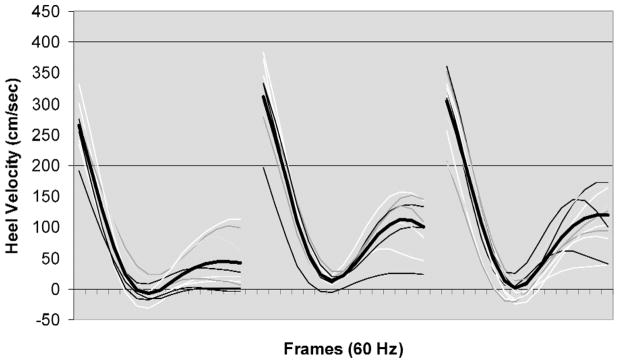
Figure 5.
Heel velocity profiles of young (left panel), middle (middle panel), and older (right panel) age groups (116 ms before and 116 ms after heel contact). Each tick marker (frame) represents 1/60 s. Heel contact was defined as the time when the vertical ground reaction force exceeded 10 N. The darker lines represent averages of heel contact velocities in each of the age groups.

