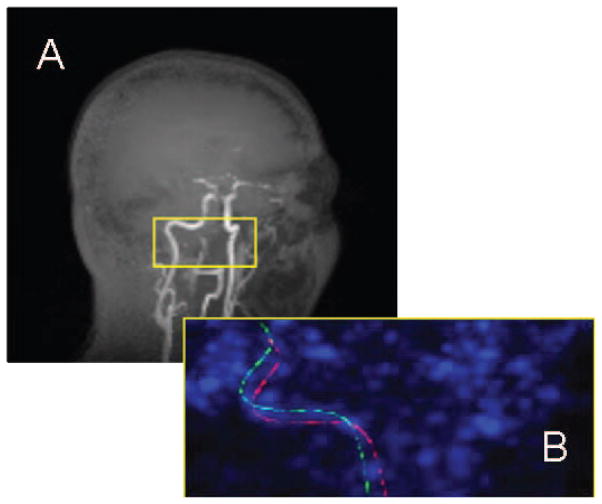
Fig. 1.
Maximum intensity projections of (A) T1-weighted MR image of human head with brain subtracted for clarity and (B) zoomed image of centerlines in early PET image. (A) Yellow box on orthogonal MR image shows approximate location of bounding box. (B) Initial position of centerline as determined by whole brain registration is shown in green. Position of centerline after local re-registration is shown in red.

