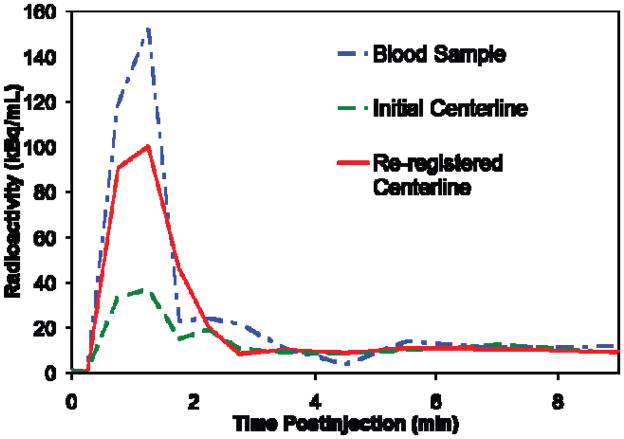
Fig. 3.
Example of results for an individual subject. Spline centerline approximation with five control points was used. Note that peaks are temporally well synchronized. The curve for centerline positioned by whole brain registration (shown in green) is lower than that for centerline positioned by local re-registration (shown in red). Both are lower than the curve derived from the automated blood counter (shown in blue).

