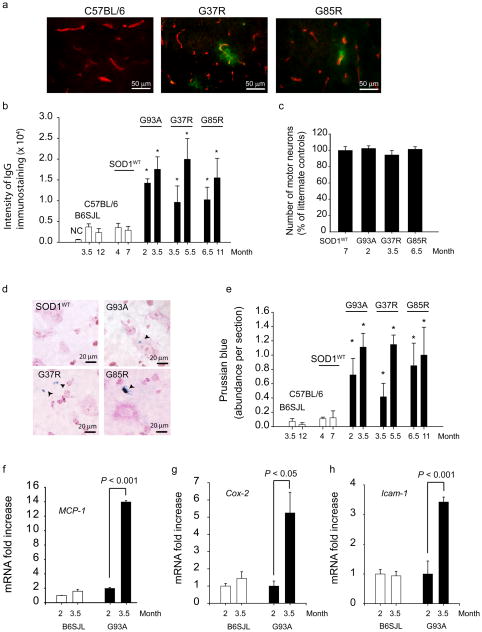
Figure 1. Breakdown of the blood-spinal cord barrier with microhemorrhages in different SOD1 mutants presymptomatically.
(a) Double immunostaining for IgG (green) and CNS endothelium (CD31, red) in the lumbar spinal cord of wild type mouse and 3.5 months old SOD1G37R and 6.5 months old SOD1G85R mutants. (b) Quantification of the IgG signal intensity in the lumbar spinal cord of different SOD1 mutants at varying ages compared to their respective controls and SOD1WT mice. NC, negative controls (omission of IgG antibody). (c) The number of motor neurons in the lumbar cord of different SOD1 mutants at an early stage of the disease process and in SOD1WT mice expressed as a percentage of total number of motor neurons in non-transgenic controls. (d) Hemosiderin extra-neuronal and neuronal deposition in the lumbar spinal cords in different SOD1 mutants, but not in SOD1WT mice. (e) Quantification of hemosiderin deposits in the lumbar spinal cord of different SOD1 mutants, controls and SOD1WT mice. (f–h) Quantitative RT-PCR analysis of mRNA transcripts for MCP-1, Cox-2 and Icam-1 in the lumbar spinal cord of SOD1G93A mice and controls at different age. Values are means ± s.e.m., n = 3–6 mice per group. *P < 0.05 compared to SOD1WT or non-transgenic mice. All procedures were according to the NIH guidelines and approved by the University of Rochester Committee on Animal Resources.

