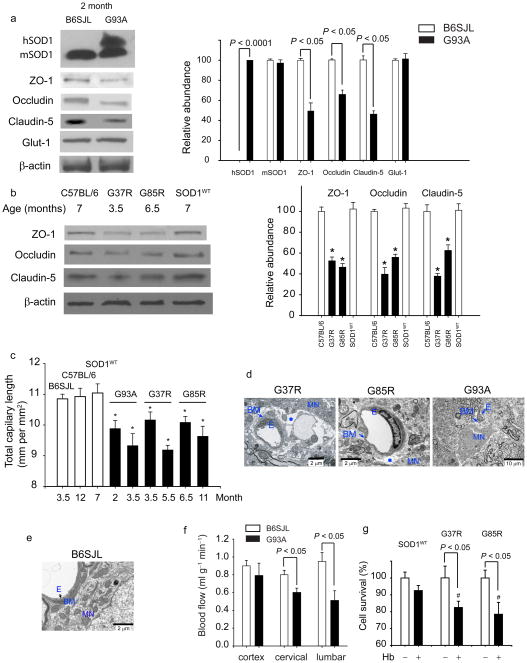
Figure 2. SOD1 toxicity to endothelium results in loss of tight junction proteins and reductions in microcirculation and blood flow.
(a) Immunoblot analysis of human hSOD1, mouse mSOD1, ZO-1, occludin and claudin-5, and Glut-1 in spinal cord microvessels from 2 months old SOD1G93A mice compared to controls. Graph - band density for test-proteins relative to β-actin. (b) Immunoblot analysis of ZO-1, occludin and claudin-5 in the spinal cord capillaries from 7, 3.5 and 6.5 months old C57BL/6, mice, SOD1G37R and SOD1G85R mutants, respectively, and 7 months old SOD1WT mice. Graph - band density for test-proteins relative to β-actin. *P < 0.05, SOD1 mutants vs. controls or SOD1WT mice. (c) Total capillary length in the anterior horn of the lumbar spinal cord in SOD1 mutants (mm CD31-positive structures per mm2). *P < 0.05, SOD1 mutants vs. age matched controls. (d–e) Transmission electron microscopy (TEM) in 3.5 and 6.5 months old SOD1G37R and SOD1G85R mutants, respectively, shows edema (asterisk) between the capillary wall and motor neurons. Collapsed capillary lumen in SOD1G93A mice. E, endothelium; BM, basement membrane, MN, motor neuron. (e) TEM of B6SJL mouse shows normal neuronal-vascular contact and intact endothelium. (f) Blood flow through the spinal cord and frontal cortex in 8 weeks old SOD1G93A mice compared to controls. (g) Hemoglobin (Hb) toxicity to N2a cells transduced with SOD1G37R and SOD1G85R mutants and SOD1WT. #P < 0.05, SOD1G37R or SOD1G85R vs. SOD1WT. Mean ± s.e.m. a–c and f, n = 3–5 mice per group. g, n = 4 experiments per group.

