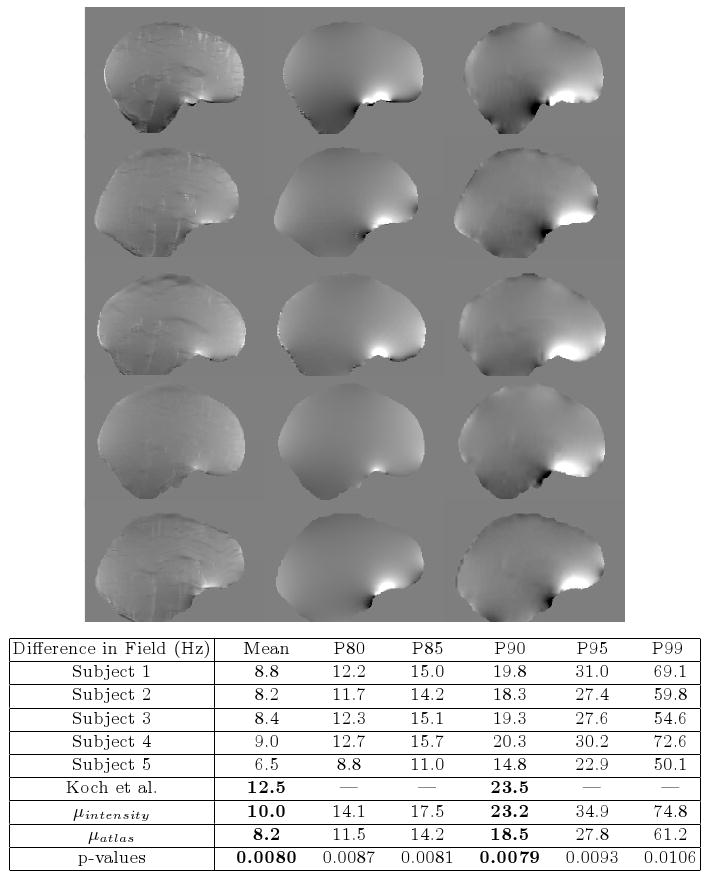
Fig. 2.

Results of the Fieldmap Estimation. Predicted and acquired fieldmaps for subjects 1-5 are shown in rows 1-5 respectively. Fieldmaps predicted using the intensity classifier (column 1) show significant differences relative to the acquired fieldmaps (column 3), while those computed from the atlas-based segmentation show improved agreement (column 2). The absolute difference between the acquired fieldmaps and the atlas-based fieldmaps are given for each subject in the table above. 90% of voxels show differences that are less than 22.3 Hz, the bandwidth/pixel for the FBIRN EPI data. Results reported by Koch et al. [8] for a single subject are shown, as well as mean statistics across all five subjects for both the intensity classifier and atlas-based classifier. The atlas-based classifier performs better than the Koch and intensity-based methods and the improvement over the intensity method is statistically significant (all p-values < 0.05 for left-sided paired t-test). The scale of the fieldmaps is ±100 Hz.
