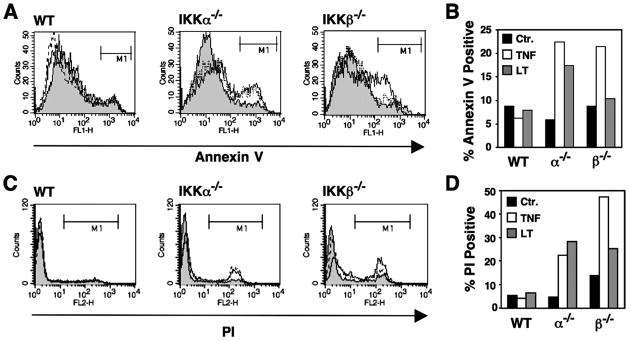
FIGURE 1. TNF and LTα1β2 induce cell death in IKKα−/− and IKKβ−/− MEFs.
A, MEFs were untreated (shaded) or treated with TNF (10 ng/ml; solid line) or LTα1β2 (100 ng/ml; dotted line) for 18 h. Cells were harvested, stained with Alexa Fluor-conjugated annexin V, and analyzed by FACS. The percentage of positively stained cells gated in region M1 were determined and plotted in the histogram shown in B. Ctr, control. C, MEFs were treated as in A then incubated in PBS containing PI and analyzed by FACS. The percentage of membrane-permeable cells that took up PI gated in region M1 was determined, and these data are shown in the histogram in panel D.

