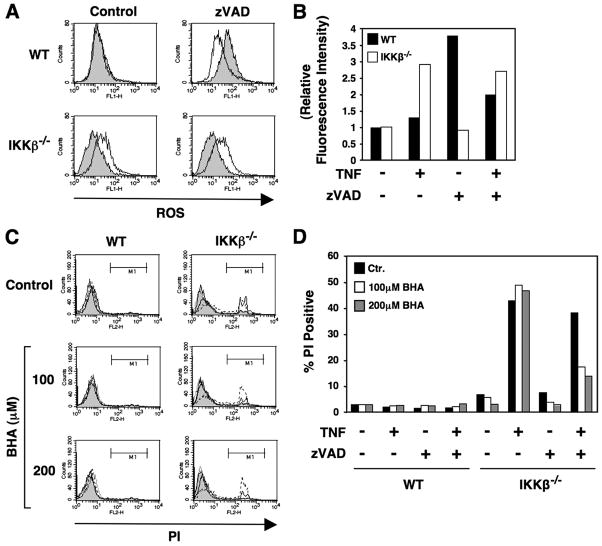
FIGURE 7. The death of IKKβ−/− cells treated with TNF and zVADfmk is dependent on the generation of ROS.
A, WT and IKKβ−/− cells were either untreated (shaded) or treated overnight with TNF (10 ng/ml; solid line) in the absence (Control) or presence of zVADfmk (25 μM). After treatment, cells were harvested, and ROS levels were determined by FACS using H2DCFDA (10 μM. The generation of ROS relative to the levels observed in untreated WT or IKKβ−/− cells was determined and is shown in panel B. C, WT or IKKβ−/− MEFs were either untreated (Control) or pretreated for 60 min with BHA at the concentrations indicated (left) before either no further treatment (shaded) or overnight treatment with TNF (10 ng/ml; dashed line), zVADfmk (25 μM; dotted line), or TNF plus zVADfmk (solid line). Cells were harvested, incubated in PBS containing PI, and analyzed by FACS. The percentage of the population that were PI positive was determined from region M1 and is shown in panel D.

