
Figure 10. Peak SPL of DCs and USDs.
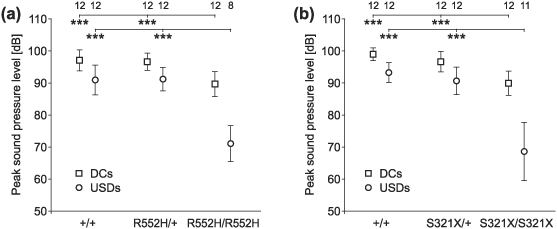
(a, b) DCs and USDs of homozygotes of both mouse lines were softer than the calls emitted by the respective heterozygous and wild-type animals. Sounds of 8–12 animals per group could be analysed (see numbers in the top row of the figure).