
Figure 1.
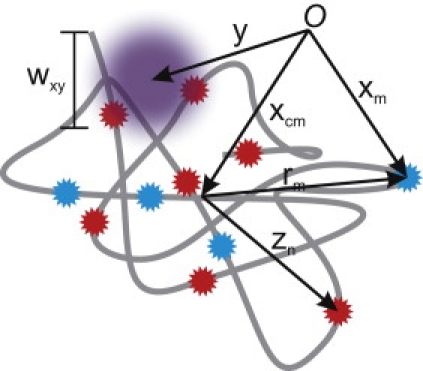
Typical experimental scenario. The gray curve represents a molecule sparsely labeled with red and cyan dyes. The circular violet region represents the tFCS probe beam (the larger tracking beam is not illustrated). Vectors xcm, xm, and y relative to the arbitrary origin O represent the center of mass of the molecule, position of tFCS dye m, and beam position, respectively. Dye positions relative to xcm (rm for tFCS dyes and zn for tracking dyes) are used in the text for convenience.