
Figure 2.
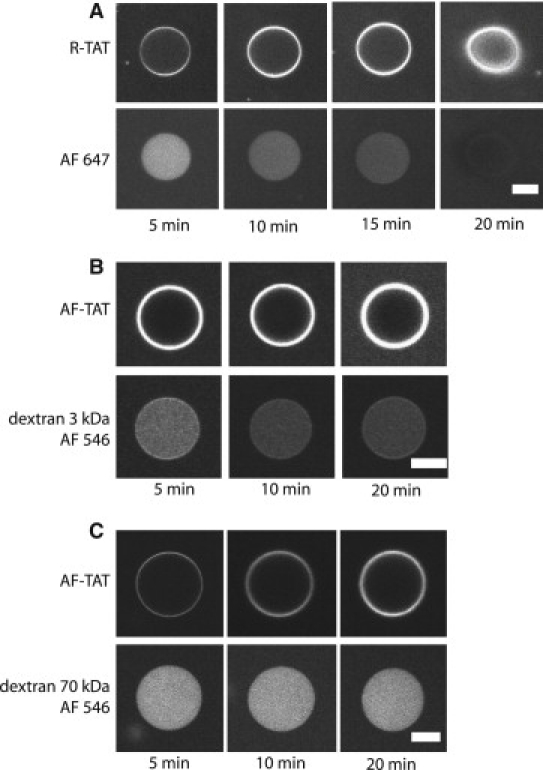
Pore formation by TAT peptides in GUVs with 40 mol % PS. (A) The upper panel shows the binding and translocation of 2 μM RTAT, and the lower panel the leakage of AlexaFluor 647, and final GUV disruption. (B) Upper panel, binding and translocation of AF-TAT peptide, lower panel shows the release of 3 kDa dextran labeled with AlexaFluor 546. (C) Upper panel, AF-TAT, lower panel 70 kDa dextran labeled with AlexaFluor 546. Scale bar, 20 μm.