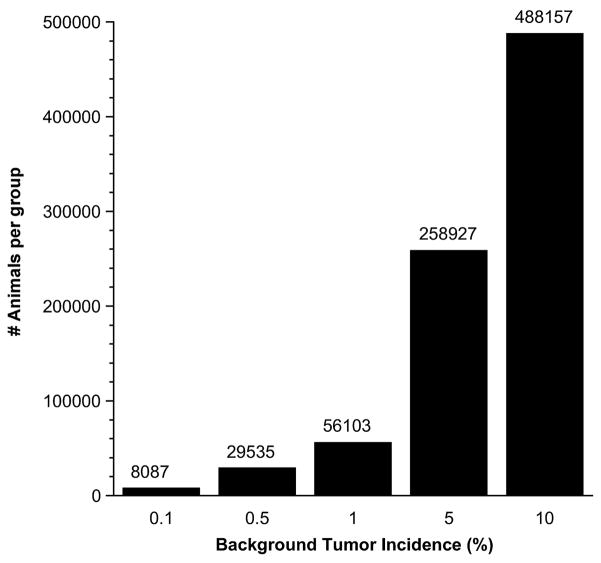
Figure 1.
Estimated number of animals required in each group to provide 50% power to demonstrate a statistically significant difference (p-value of 0.1) for one excess tumor in 1000 animals based on background tumor incidence. Calculations were performed according to LaMorte WW: Sample size calculations in research. Boston University Medical Center (http://www.uml.edu/ora/institutionalcompliance/IACUC/LaMorte%20Sample%20Size%20Calc%20Paper.pdf).

