
Figure 5.
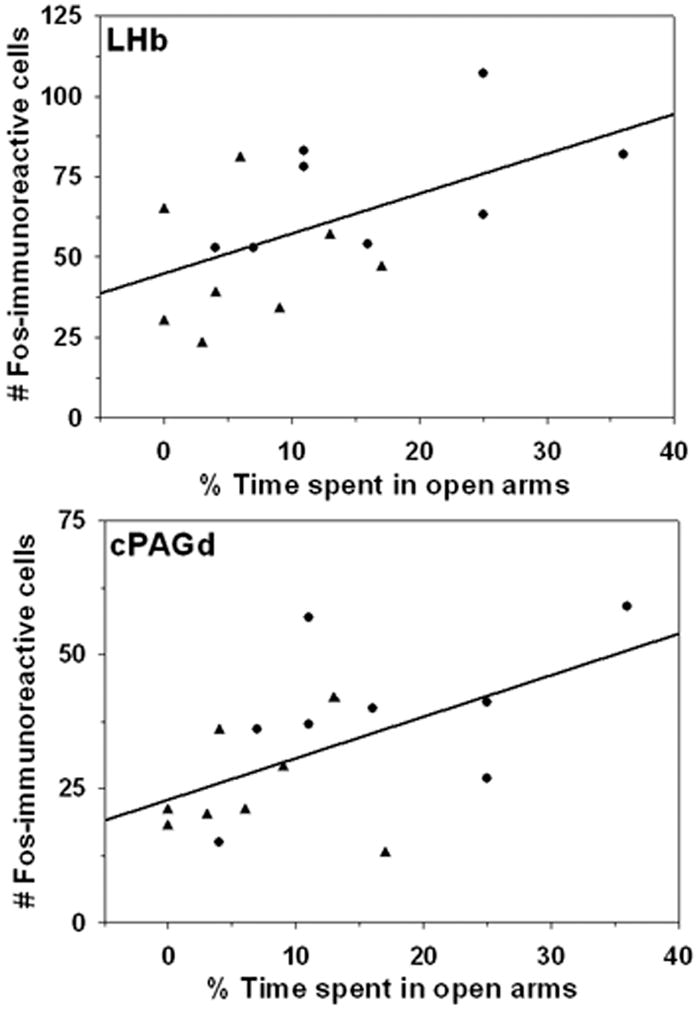
Correlations between the number of Fos-immunoreactive cells in the LHb (top) and cPAGd (bottom) and the percentage of time dams spent in open arms of an elevated plus maze. Circles represent dams with pups before testing, and triangles indicate dams whose pups were removed before testing.