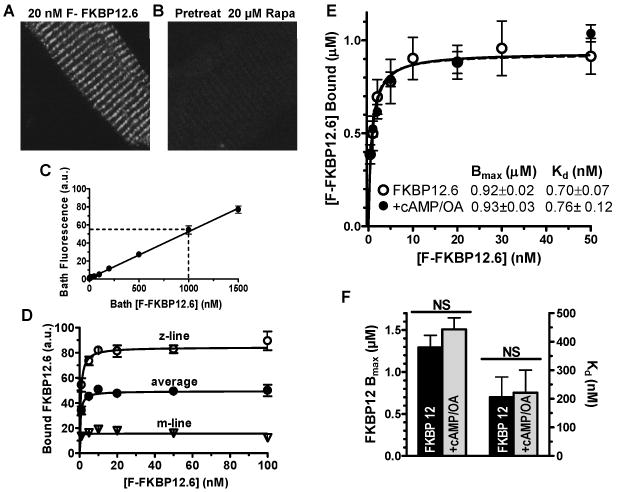
Figure 4. Steady-state Kd and Bmax of F-FKBP in myocytes.

A, Confocal myocyte image with 20 nM bath [FKBP12.6]; B, Same as A but myocyte was pretreated with 20 μM rapamycin; C, Dependence of bath F-FKBP12.6 fluorescence on [F-FKBP12.6]. D, Background-corrected (bath & auto-fluorescence) fluorescence intensity from Z-line, M-line and average, plotted vs. bath [FKBP12.6]. E, Calibrated F-FKBP12.6 binding using known bath concentration and fluorescence (fit with one-site isotherm; n=4 rats). F, Influence of cAMP/OA pretreatment on apparent Bmax and Kd (n=4 rats).
