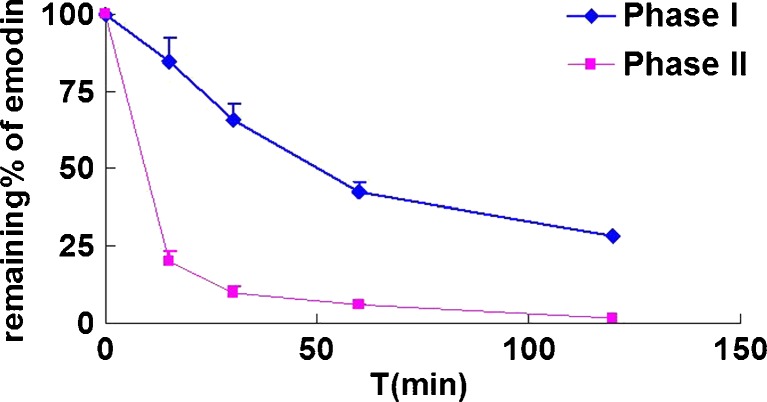
Fig. 2.
Comparison of phase I oxidation and glucuronidation metabolisms of 40 μM emodin. Using different protein concentration (1 mg/mL for phase I oxidation reaction and 0.053 mg/mL for glucuronidation reaction), amounts of emodin remained in the reaction mixture (expressed as percent remaining) was monitored and compared after phase I (a CYP reaction system) or phase II (a UGT reaction system) metabolism of emodin was allowed to proceed as a function of time at 37°C. The experimental conditions were described in details in “MATERIALS AND METHODS”. Each point represents the average of three determinations and error bar are the standard deviation of the means (n = 3)

