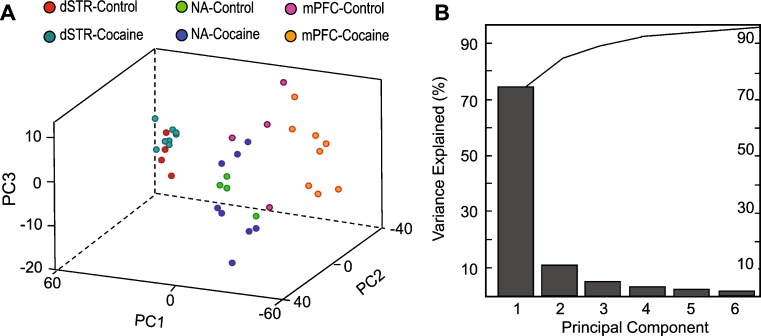
Fig. 4.
PCA of MS data normalized to total ion count. A PC score graph for control and acute cocaine groups demonstrate segregation of brain regions according to the peptide profiles between control and cocaine treated groups. Each data point represents an individual sample. The mPFC extracts from control and cocaine-treated animals are clearly distinguished on the basis of their peptide profiles. B Contribution of PCs constituting 95% of variance

