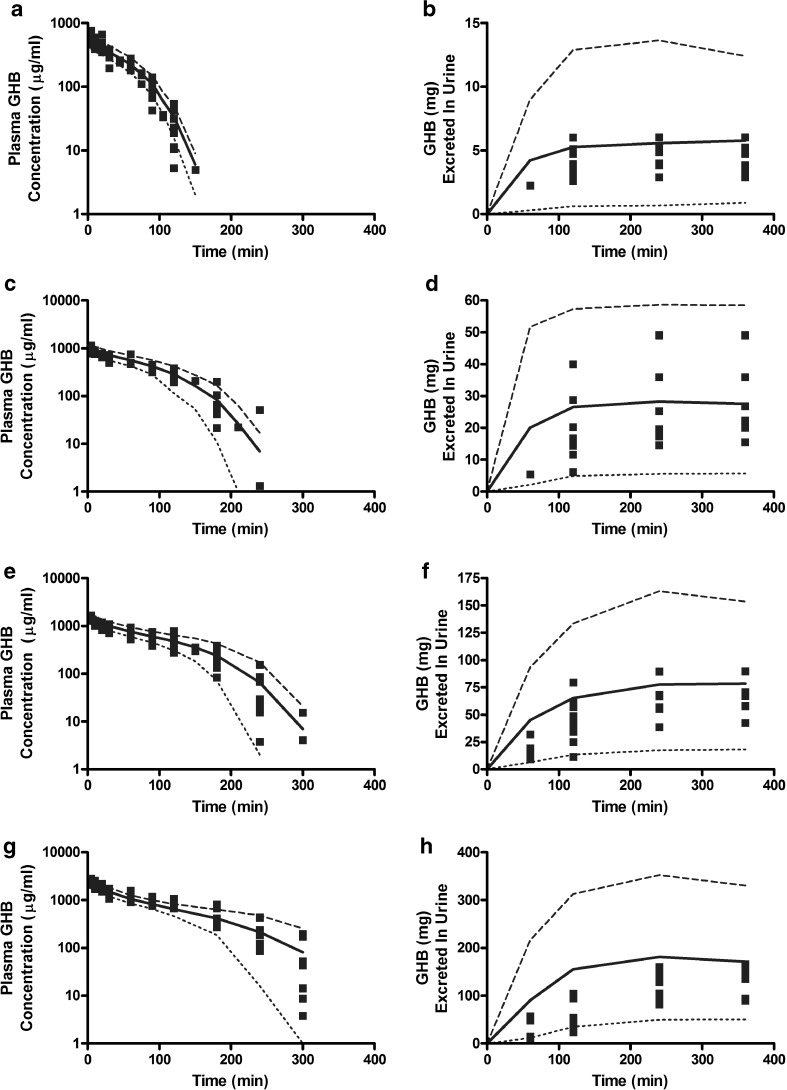
Fig. 2.
VPC plots following iv administration of GHB for the final population model detailed in Fig. 1 and Table I. Solid squares represent individual data points (N = 7–10 rats per dose). The plotted lines are based on 1,000 simulated plasma concentration-time (panels a, c, e, and g) and urinary excretion (b, d, f, and h) profiles for each dose. The mean (solid line) and 10th (dotted line) and 90th (dashed line) percentiles were calculated from the predicted concentrations. GHB doses: a, b 200 mg/kg; c, d 400 mg/kg; e, f 600 mg/kg; g, h 1,000 mg/kg

