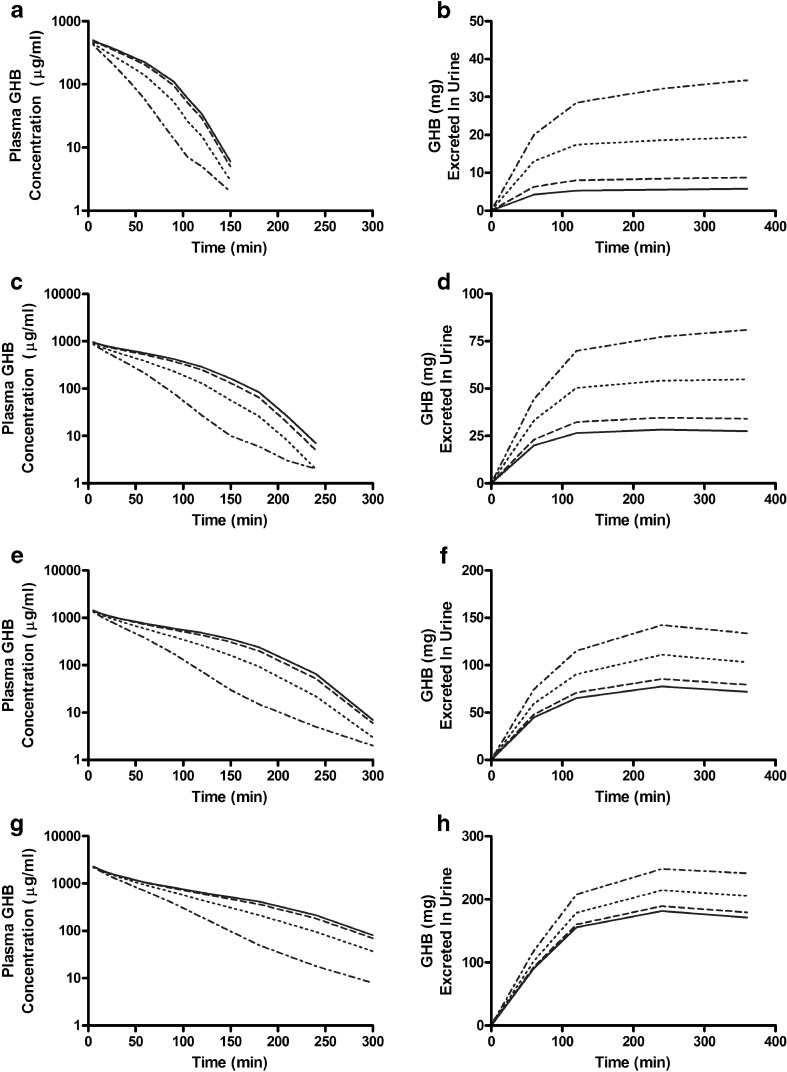
Fig. 3.
Simulations of GHB-transporter inhibitor interactions in rats. GHB was administered IV in the absence (solid line) or presence of a fixed concentration of inhibitor where R (I/K i) is equal to 1 (dashed line), 10 (dotted line), and 100 (dot/dash line). Simulations of plasma concentration-time and urinary excretion profiles were conducted based on competitive inhibition of renal reabsorption. GHB doses: a, b 200 mg/kg; c, d 400 mg/kg; e, f 600 mg/kg; g, h 1,000 mg/kg

