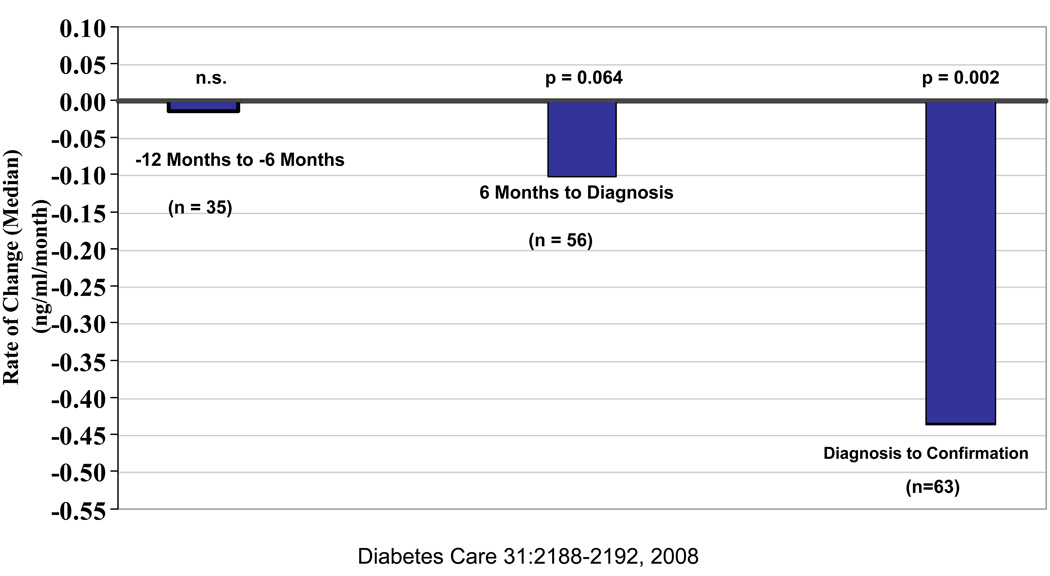
Figure 1. Rate of Change of Peak C-Peptide over Peri-Onset period.
Rates of change in peak C-peptide in the perionset period. Shown are the rates of change of peak C-peptide levels according to intervals before and after diagnosis. C-peptide levels changed minimally between~12 and 6 months before diagnosis. There was a decline in the 6 months before diagnosis. There was a decline in the 6 months before diagnosis that was more substantial in the period after diagnosis.

