Figure 3.
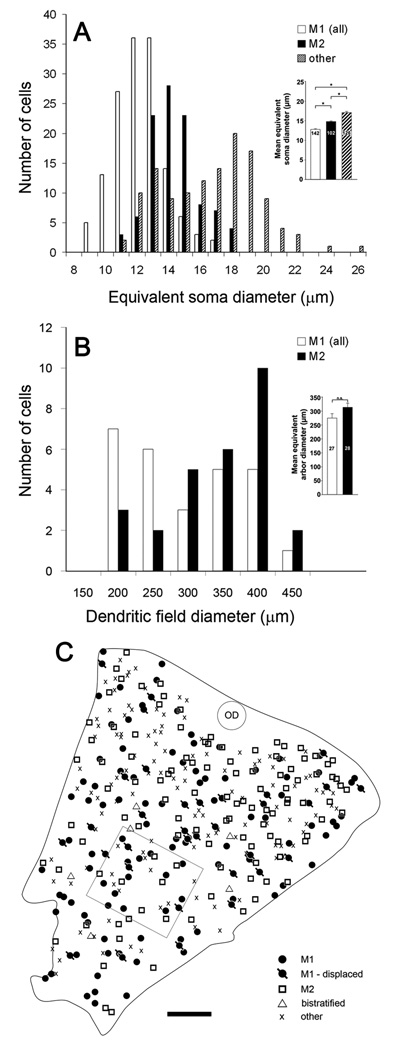
Somatic and dendritic-field sizes of several types of melanopsin immunopositive ganglion cells and their spatial distribution in the retina. A: Histogram of equivalent soma diameter of M1 cells (combining conventionally placed and displaced varieties), M2 cells, and the very weakly immunopositive cell bodies without appreciable dendritic staining (“other”). Bistratified cells are not included. Inset : Soma sizes (mean ± SEM) of M1, M2, and “other” cells. Asterisks indicate statistically significant differences (p<0.05). B: Distribution of dendritic field diameters of M1 cells, including displaced M1 cells (white bars;) and M2 cells (black bars). Inset: equivalent dendritic-field diameters (mean ± SEM) of M1 and M2 cells. Asterisks indicate statistically significant difference (p<0.01). C: Map of the distribution of melanopsin immunoreactive cells within a piece of retinal wholemount tissue (rectangular outline indicates location of zone shown in Fig. 2A–C). Different symbols represent different types of melanopsin cells, as determined for each cell from its dendritic stratification and somatic location (ganglion cell layer or inner nuclear layer). The “other” category refers to weakly immunopositive cell bodies without appreciable dendritic staining. OD : optic disk. Scale bar: 250 µm.

