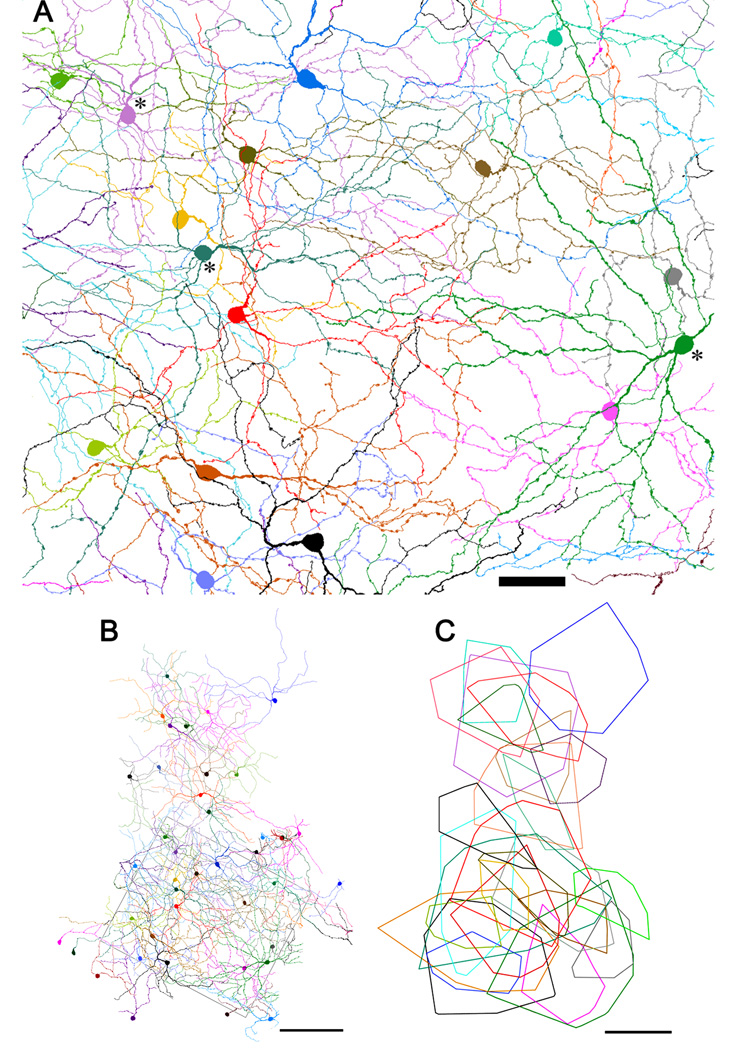
Figure 5.
The mosaic of M1 cells. A: Reconstruction of the M1 cell mosaic within the retinal region illustrated in Figs. 2A–C. Three displaced cells are included, indicated by asterisks near cell bodies. The processes of bistratified cells within the outer plexus have been excluded. Scale bar: 50 µm B: Reconstruction of the same mosaic over a larger area, shown at reduced magnification. Rectangular outline marks the region illustrated in panel A and Figs. 2A–C. Not all cells outside the rectangle have been fully reconstructed. Scale bar: 200 µm. C: Dendritic field areas of fully reconstructed M1 cells from panel B represented as minimal convex polygons fully enclosing the dendritic profile. Scale bar: 200 µm.

