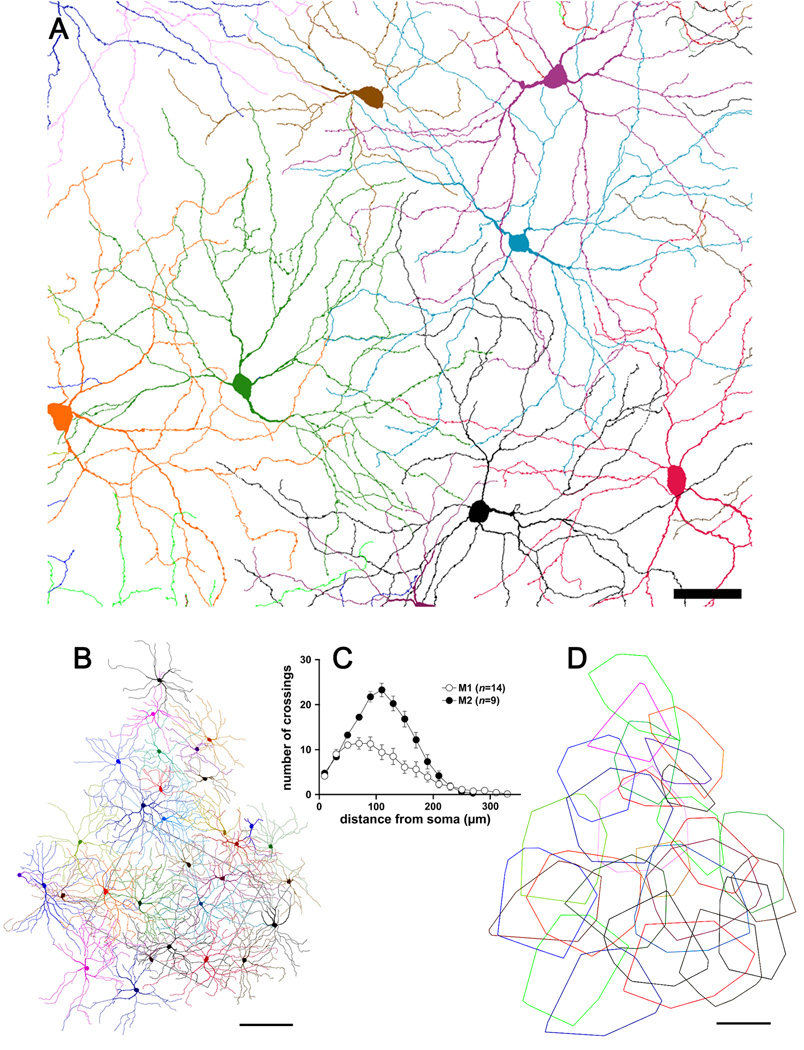
Figure 7.
The mosaic of M2 cells. A: Reconstruction of the M2 cell mosaic within the retinal region illustrated in Figs. 2A–C. The processes of bistratified cells within the inner plexus have been excluded. Scale bar: 50 µm. B: Reconstruction of the same mosaic over a larger area, shown at reduced magnification. Rectangular outline marks the region illustrated in panel A and Figs. 2A–C and Fig. 5A. C: Sholl analysis of dendritic branching pattern of M2 cells in comparison to that in M1 cells. Mean number of dendritic crossings ± SEM. D: Dendritic field areas of fully reconstructed M2 cells from panel B represented as minimal convex polygons fully enclosing the dendritic profile. Scale bar: 200 µm.

