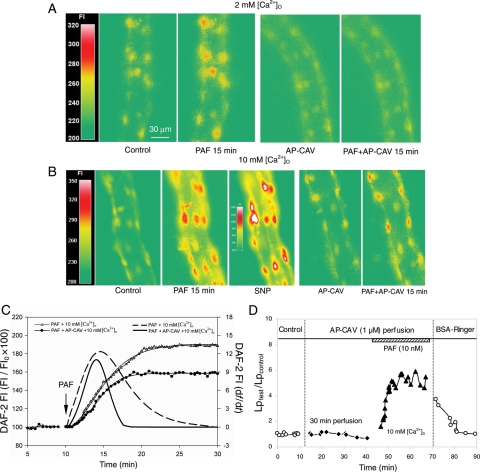
Figure 4.
AP-CAV and endothelial [Ca2+]i antagonistically regulate PAF-induced NO production and Lp increases. (A) Fluorescence images from two of the experiments showing the difference in PAF-induced NO production (DAF-2 FI changes relative to control) in the absence (left panel) or presence of applied AP-CAV (right panel). (B) Images from two of the experiments demonstrating the magnitude of the differences in NO production under normal and high [Ca2+]o. The left panel indicates that high [Ca2+]o potentiated PAF-induced NO production and the right panel shows that high [Ca2+]o partially restored AP-CAV-mediated NO reduction to a level comparable to that shown in the left panel of (A). The third image in the left panel shows further increases in FI after superfusion with NO donor sodium nitroprusside (SNP), which is the routine at end of each NO measurement to check the dye loading status. (C) The NO quantification from the images shown in (B) demonstrates that PAF stimulated cumulative DAF-2 FI and the calculated NO production rates as a function of time under high [Ca2+]o, with or without AP-CAV application. (D) Lp measurements showing that AP-CAV perfusion resulted in a moderate Lp increase under high [Ca2+]o, indicating that attenuated NO production by AP-CAV can override the high Ca2+ signal serving as a key determinant of Lp increases.

