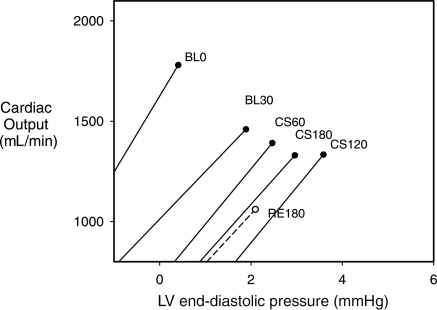
Figure 6.
Cardiac function curves generated by vena caval occlusion. Cardiac function was determined as the cardiac output achieved for a given end-diastolic pressure. Data were collected at baseline (BL0), 30 min after BL0 (BL30), 1 h after coronary sinus balloon inflation (CS60), 2 h after inflation (CS 120), 3 h after inflation (CS180) and 3 h after balloon deflation (RE180). (Composed from data in Stewart.64)

