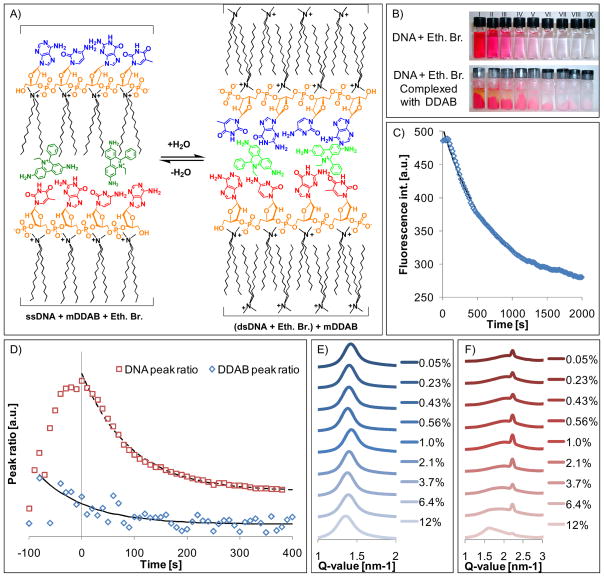
Figure 6.
Structural analysis of ethidium bromide-labeled films. (A) Expected structural change of the DNA-DDAB film with added ethidium bromide between the dry and wet states. Ethidium bromide is shown in green, intercalating between the DNA base-pairs in the wet state, while it associates both with the exposed hydrophobic DNA bases and DDAB tails in the dry state. (B) Photographs of aqueous solutions or suspensions of (top) DNA with varying amounts of ethidium bromide and (bottom) DNA-DDAB complexes labeled with ethidum bromide. The supernantant used in the UV-Vis studies to measure the amount of ethidium bromide intercalation is the liquid taken from the bottom row of suspensions (see Supporting Information, Figure S13). The numbers I-IX refer to varying percentages 0.05–12% ethidium bromide, respectively. (C) Decay in fluorescence over time of a wetted 6.4% ethidium bromide-labeled film as it dried, agreeing with earlier data that suggests DNA is double-stranded in the wet film and becomes single-stranded in the dry film, and thus can no longer intercalate ethidium bromide which can then no longer fluoresce. Curve fitting indicates that the decay is exponential. (D) Variations in the peak ratio of a 6.4% ethidium bromide wetted film as it dries over time fitted with an exponential curve equation. K values for both DNA and DDAB ratio decay are nearly identical to that of the normal DNA-DDAB films (see Figure 1). (E) SAXS spectra of wet films labeled with varying amounts of ethidium bromide. (F) SAXS spectra of the same films in the dry state.

