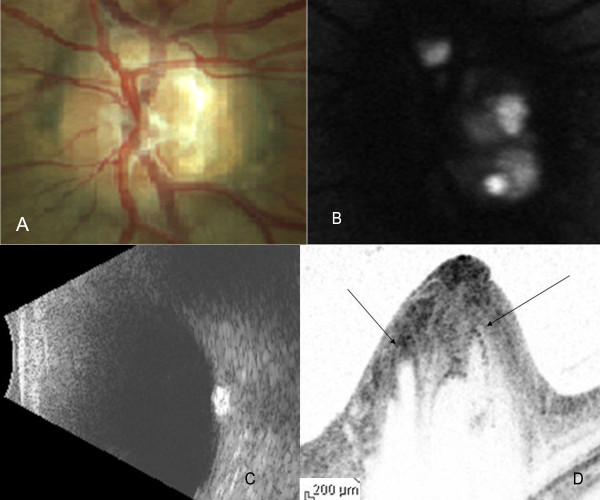
Figure 2.
Color fundus photograph (A), FAF image (B), B-Scan ultrasound (C) and cross-sectional Spectralis OCT image (D) of subject 2 in the study. The intensity of FAF image has been turned down to highlight the high reflectivity of the drusen. Arrows on the Spectralis OCT cross-sectional image indicate the position of the drusen.

