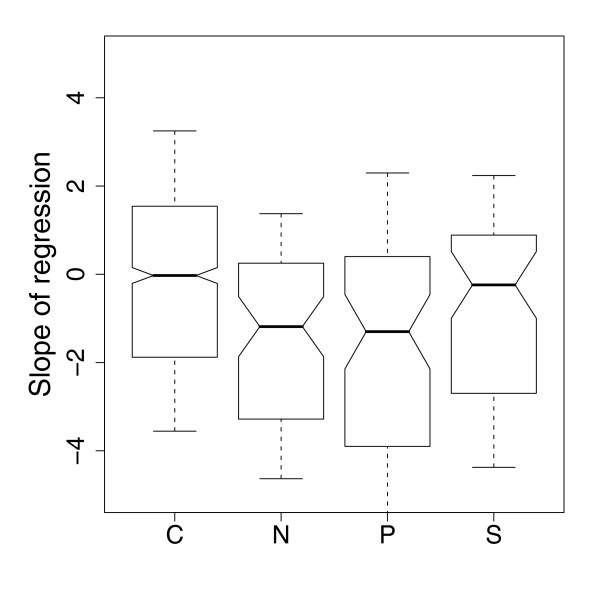
Figure 11.
Distribution of the regression slopes fit to expression data of genes significantly up regulated in the nutrient limitation indicated (FDR < 5%). Negative slopes mean the gene is down-regulated with increasing growth rate. Bold lines represent the median slope for that nutrient; boxes represent the inter-quartile range; boxes whose notches do not overlap have average slopes that are significantly different from each other (P < 0.05).

